
Category: Lab Tests and Imaging

Substantial Discrepancies found Between Estimated and Measured GFR

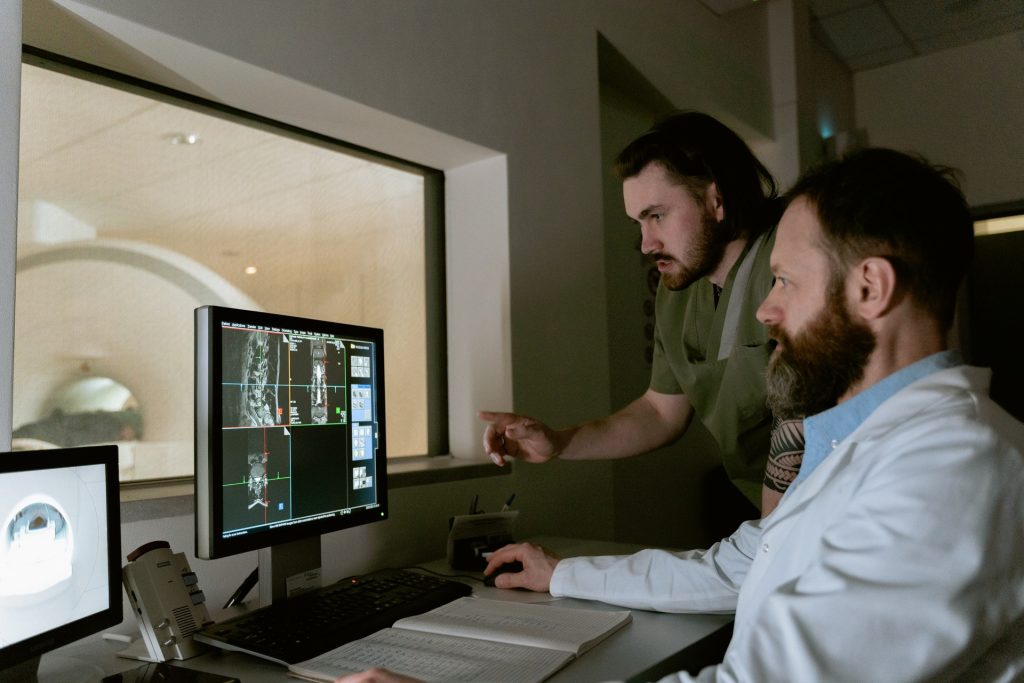
Photo by Cottonbro on Pexels

A cross sectional study published in Annals of Internal Medicine uncovered substantial discrepancies between individual estimated glomerular filtration rate (eGFR) and directly measured GFR (mGFR).The authors suggest that eGFR calculations on lab reports also state this distribution of uncertainty, and also that renaming the eGFR as a population average GFR (or paGFR) merits further discussion.

GFR is the standard metric used to assess and monitor kidney function. Directly measured GFR, or mGFR, requires injecting a filtration marker and measuring plasma or urinary clearance by serial blood and urine sampling under standardized conditions is not possible for every patient. So eGFR calculated from serum creatinine is often used by clinicians to predict an mGFR. Population-level discrepancies between eGFR and mGFR are low, but individual discrepancies are much higher. It is important to understand the magnitude of these individual-level differences for clinical decision making.

Researchers calculated eGFR from serum creatinine alone and cystatin C and creatinine using the Chronic Kidney Disease Epidemiology Collaboration equations for 3223 participants and compared their eGFR to their mGFR to quantify the magnitude and consequences of the individual-level differences between the two. The authors found substantial discrepancies between directly measured GFR and estimated GFR, resulting in only about 50% agreement between CKD stages. Individual-level differences between the mGFR and the eGFR did not improve substantially using cystatin C.

The authors suggested that several factors contribute to these discrepancies: creatinine and cystatin C have non-GFR factors influencing their serum concentration; variability in the mGFR can result from normal physiology and measurement error from mGFR markers and technique; and as GFR estimation models the ratio of mGFR–body surface area as a function of serum markers, it incorporates errors in mGFR and errors in body surface area calculated from height and weight.

The authors say that their findings highlight the need to make direct GFR measurements available to patients who need them. They note that implementation studies are needed in this area, and research is needed to assess how the availability and use of mGFRs change clinical management.

Source: EurekAlert!
PET/CT Scans Fail to Beat MRI for Prostate Cancer Detection

Credit: Darryl Leja / National-Human-Genome Research Institute / National Institutes of Health

Researchers found that MRI scans, the current gold standard, can still detect prostate cancer more accurately than the newer, prostate-specific -PSMA PET/CT scanning technique.

The findings were presented at the European Association of Urology’s annual congress (EAU22).

Prostate-specific membrane antigen (PSMA) PET/CT scans, approved by the US FDA in 2020, use a radioactive dye to highlight areas of PSMA, which is overexpressed on the surface of prostate cancer cells. Presently, these scans are used to manage prostate cancer, as they can accurately measure the progression or recurrence of the disease. The researchers set out to find if they could be used to diagnose prostate cancer as well.

The PEDAL trial recruited 240 patients at risk of prostate cancer, with each patient given both an MRI scan and a PSMA PET/CT scan. If imaging suggested the presence of prostate cancer, a biopsy was performed by the patient’s urologist.

The MRI scans picked up abnormalities in 141 patients, while the PSMA PET/CT scans picked up abnormalities in 198 patients. A total of 181 patients (75%) underwent a prostate biopsy, and subsequently 82 of those patients were found to have clinically significant prostate cancer.

The MRI scans were significantly more accurate at detecting any grade of prostate cancer than the PSMA PET scans.

The research team was led by Associate Professor Lih-Ming Wong, who explained: “Our analysis found that MRI scans were better than PSMA-PET for detecting any grade of prostate cancer. When we looked only at clinically significant prostate cancers, there was no difference in accuracy.  As this study is one of the first to explore using PSMA-PET to diagnose cancer within the prostate, we are still learning and adjusting how to improve using PSMA-PET in this setting.

Although detection thresholds will be  fine-tuned as diagnostic use develops,  Prof Wong believes the trial has important lessons for clinicians. 

He said: “This study confirms that the existing ‘gold standard’ of pre-biopsy detection – the MRI – is indeed a high benchmark. Even with fine-tuning, we suspect PSMA PET/CT won’t replace the MRI as the main method of prostate cancer detection. But it will likely have application in the future as an adjunct to the MRI, or for people for whom an MRI is unsuitable, or as a single combined “diagnostic and staging” scan for appropriately selected patients.”

Source: EurekAlert!

Retinal Scans May be Able to Detect ASD and ADHD

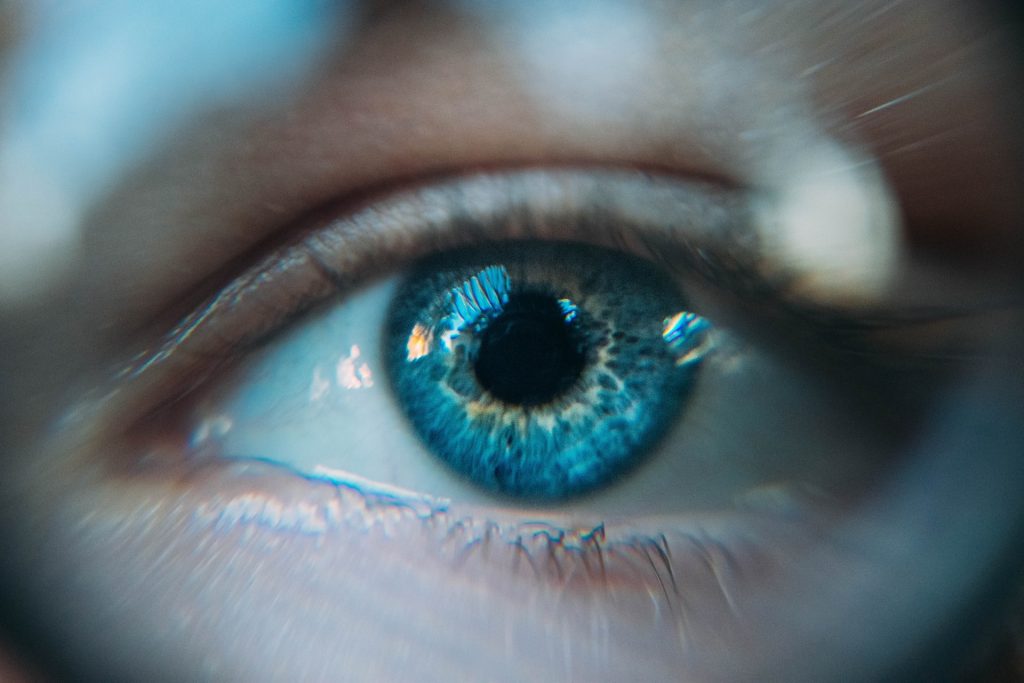
Eye
Source: Daniil Kuzelev on Unsplash

By measuring the electrical activity of the retina in responses to a light stimulus, researchers found that they may be able to neurodevelopmental disorders such as ASD and ADHD, as reported in new research published in Frontiers in Neuroscience.

In this groundbreaking study, researchers found that recordings from the retina could identify distinct signals for both Attention Deficit Hyperactivity Disorder (ADHD) and Autism Spectrum Disorder (ASD) providing a potential biomarker for each condition.

Using the ‘electroretinogram’ (ERG) – a diagnostic test that measures the electrical activity of the retina in response to a light stimulus – researchers found that children with ADHD showed higher overall ERG energy, whereas children with ASD showed less ERG energy.

Research optometrist at Flinders University, Dr Paul Constable, said the preliminary findings indicate promising results for improved diagnoses and treatments in the future.

“ASD and ADHD are the most common neurodevelopmental disorders diagnosed in childhood. But as they often share similar traits, making diagnoses for both conditions can be lengthy and complicated,” Dr Constable says.

“Our research aims to improve this. By exploring how signals in the retina react to light stimuli, we hope to develop more accurate and earlier diagnoses for different neurodevelopmental conditions.

“Retinal signals have specific nerves that generate them, so if we can identify these differences and localise them to specific pathways that use different chemical signals that are also used in the brain, then we can show distinct differences for children with ADHD and ASD and potentially other neurodevelopmental conditions.”

“This study delivers preliminary evidence for neurophysiological changes that not only differentiate both ADHD and ASD from typically developing children, but also evidence that they can be distinguished from each other based on ERG characteristics.”

According to the World Health Organization, one in 100 children has ASD, with 5–8% of children diagnosed with ADHD.

Attention Deficit Hyperactivity Disorder (ADHD) is a neurodevelopmental condition characterised by being overly active, struggling to pay attention, and difficulty controlling impulsive behaviours. Autism spectrum disorder (ASD) is also a neurodevelopmental condition where children behave, communicate, interact, and learn in ways that are different from most other people.

Co-researcher and expert in human and artificial cognition at the University of South Australia, Dr Fernando Marmolejo-Ramos, says the research has potential to extend across other neurological conditions.

“Ultimately, we’re looking at how the eyes can help us understand the brain,” Dr Marmolejo-Ramos says.

“While further research is needed to establish abnormalities in retinal signals that are specific to these and other neurodevelopmental disorders, what we’ve observed so far shows that we are on the precipice of something amazing.

“It is truly a case of watching this space; as it happens, the eyes could reveal all.”

Source: Flinders University

Rapid Blood Assay to Test for COVID Immunity

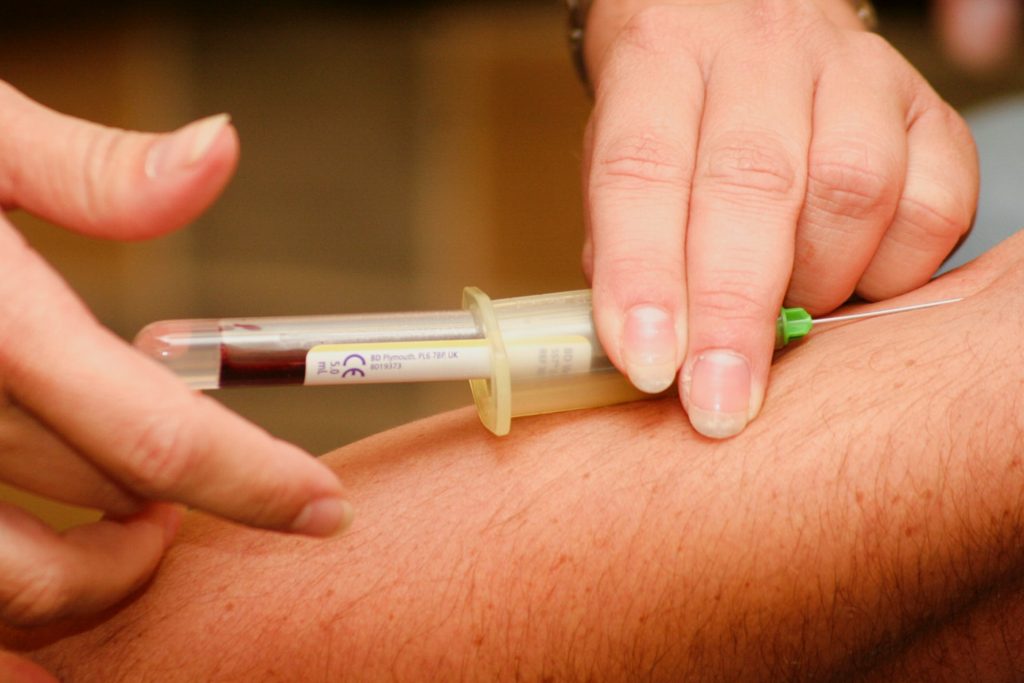
Blood sample being drawn
Photo by Hush Naidoo Jade Photography on Unsplash

Researchers have developed a rapid blood assay that measures the strength and duration of an individual’s immunity to SARS-CoV-2. This test will allow population-scale monitoring immunity and vaccine effectiveness. This will help to design revaccination strategies for vulnerable immunosuppressed individuals, according to a study published by the researchers from Mount Sinai in Nature Biotechnology.

The test, which measures the activation of T cells, is performed in under 24 hours and can be scaled up significantly.

“The assay we have created has the ability to measure the population’s cellular immunity and broadly test the efficacy of novel vaccines,” said one of the study’s senior authors, Ernesto Guccione, PhD, Professor at Mount Sinai. “We know that vulnerable populations don’t always mount an antibody response, so measuring T cell activation is critical to assess the full extent of a person’s immunity. Additionally, the emergence of SARS-CoV-2 variants like Omicron, which evade most of the neutralising ability of antibodies, points to the need for assays that can measure T cells, which are more effective against emerging variants of concern.”

Long-term protection from viral infection is mediated by both antibodies and T cell response. Many recent studies point to the importance of determining T cell function in individuals who have recovered from or been vaccinated against COVID to help design vaccination campaigns. However, before this study, measurement of T cell responses has been rarely performed because of the associated technical challenges.

Researchers optimised qPCR-based assays that had the potential to be globally scalable, sensitive, and accurate tests. They then selected the two assays that offered the most scalability. One, the qTACT assay, was accurate and sensitive but had a relatively longer processing time of 24 hours per 200 blood samples, a moderate price, and a medium level of technical skill. The other, the dqTACT assay, was accurate and had a reduced processing time and cost, and required minimal lab experience, making it easy to implement.

The dqTACT assay has recently received the European CE-IVD (in vitro diagnostics) certification, while U.S. Food and Drug Administration and European Medicines Agency clinical validation is ongoing.

“The assays presented here are based on the ability of SARS-CoV-2 T cells to respond to peptides covering different proteins of the virus,” said another senior author, Jordi Ochando, PhD, Assistant Professor at Mount Sinai. “With the possibility of using different peptide pools, our approach represents a flexible strategy that can be easily implemented to detect the presence of T cells responding to different viral proteins. These T cells have an important role in protection from emerging mutant strains, thus immediately gauging the impact that viral mutations might have on cellular immunity.”

Megan Schwarz, a graduate student at Icahn Mount Sinai and first author of the study, added: “Precise measurement of cellular responses underlying virus protection represents a crucial parameter of our levels of immune defence.”

Source: EurekAlert!

Amid Shortage, Suggested Ways to Conserve Contrast Agent

Technician and patient with MRI machine
Source: Mart Production on Pexels

Amid an ongoing worldwide shortage of contrast agent for medical imaging, a new UC San Francisco research letter in JAMA described strategies that can be used to safely reduce contrast agent use in computed tomography (CT) by up to 83%.

The three conservation strategies are weight-based (rather than fixed) dosing, reducing contrast dose while reducing tube voltage on scanners, and replacing contrast-enhanced CT with nonenhanced CT when it will minimally affect diagnostic accuracy.

That third strategy – not using the contrast agent in certain CT scans where there is only a small improvement in accuracy – yielded the most dramatic reduction of contrast agent use: 78%.

“Contrast is essential in any situation where we need to assess the blood vessels – for example, for some trauma patients or those with a suspected acute gastrointestinal bleed – and it is also needed for evaluation of certain cancers, such as in the liver or pancreas,” said senior study author Rebecca Smith-Bindman, MD, professor at UCSF.

“However, most CT scans are done for less specific indications such as abdominal pain in a patient with suspected appendicitis,” Prof Smith-Bindman added. “These can and should be done without contrast during the shortage, because the loss of information in these patients will be acceptable for most patients.”

The global shortage of contrast agent started in April with a COVID-related supply chain disruption of GE Healthcare in Shanghai and is expected to last at least several more weeks. More than 54 million diagnostic imaging exams using contrast agents are done every year in the US, a majority being CT scans, and these conservation methods could continue past the current shortage to reduce the use of contrast agent in general, the authors noted.

Referring clinicians are key to conservation
Researchers modelled the three strategies individually and in combination using a sample of 1.04 million CT exams in the UCSF International CT Dose Registry from January 2015 to March 2021.

On its own, weight-based dosing for abdomen, chest, cardiac, spine and extremity imaging reduced contrast agent use by 10%; reducing the tube voltage in appropriate patients allowed a contrast agent reduction of 25%. These two measures combined with using non-contrast CT when possible led to a total reduction of 83%.

Following all three strategies at once may not be possible for some facilities, but each can help conserve supply, Prof Smith-Bindman said. And it is not just radiologists who need to know about them.

“Given the acute shortage, it’s important that clinicians who order imaging exams coordinate with radiology to cancel scans that aren’t absolutely necessary, postpone exams that can be safely delayed, replace CT with MRI and ultrasound where possible, and order an unenhanced scan where possible. Further, clinicians should communicate with their patients about why this is necessary. It is crucial that contrast be conserved for clinical situations where its use is essential for accurate diagnosis,” said Prof Smith-Bindman.

After the shortage ends, medical facilities should consider continuing some of these practices that conserve contrast agent, she added. For example, reducing the tube voltage not only reduces the contrast agent used but also lowers the radiation dose. Tailoring doses weight allows lower dosing volumes for many patients.

In addition, Prof Smith-Bindman noted that this analysis highlights the large amount of contrast agent that is wasted when single-dose vials are used Hospitals and imaging centres that routinely use single-dose contrast agent vials should consider using larger multi-dose vials, which allows for exact dosing and obviates the need to discard unused portions, she said.

“By carrying some of these practices forward, we can mitigate future supply-chain risk and reduce overall waste,” said Smith-Bindman.

Source: University of California – San Francisco

A Bright Idea for MRI Cancer Detection

MRI or CT machine
Photo by Mart Production on Pexels

Researchers at the University of Waterloo have developed a new form of magnetic resonance imaging (MRI) that makes cancerous tissue glow in medical images. This innovation could enable more accurate detection and tracking of cancer over time.

“Our studies show this new technology has promising potential to improve cancer screening, prognosis and treatment planning,” said first author Professor Alexander Wong.

Irregular packing of cells leads to differences in the way water molecules move in cancerous tissue compared to healthy tissue. The new technology, called synthetic correlated diffusion imaging, highlights these differences by capturing, synthesising and mixing MRI signals at different gradient pulse strengths and timings.

In the largest study of its kind, the researchers collaborated with medical experts at the Lunenfeld-Tanenbaum Research Institute, several Toronto hospitals and the Ontario Institute for Cancer Research to apply the technology to a cohort of 200 patients with prostate cancer.

The synthetic correlated diffusion imaging was found to be better at delineating significant cancerous tissue than current imaging technique, making it a potentially powerful addition to the toolbox for doctors and radiologists.

“Prostate cancer is the second most common cancer in men worldwide and the most frequently diagnosed cancer among men in more developed countries,” said Prof Wong. “That’s why we targeted it first in our research.

“We also have very promising results for breast cancer screening, detection, and treatment planning. This could be a game-changer for many kinds of cancer imaging and clinical decision support.”

Source: University of Waterloo

Cardiac CT Matches Coronary Angiography with Fewer Complications

Coronary artery showing atherosclerosis. Image source: Wikimidia CC0

A clinical trial found that cardiac computed tomography (CT) offers similar diagnostic accuracy to catheterisation – the current standard diagnostic test for intermediate-risk patients – in people with suspected coronary artery disease, as well as being associated with a lower risk of complications. The trial’s findings were published in the New England Journal of Medicine.

The current standard diagnostic test for coronary artery disease (CAD) is coronary angiography (often along with cardiac catheterisation). This minimally invasive procedure uses dye marker visible on X-ray imaging to detect arterial narrowing. Any narrowing detected in this manner can be treated during the procedure itself using stents, which prop open the newly widened blood vessels. More than 3.5 million of these procedures are carried out in European catheterisation laboratories every year, and more are carried out every year. Approximately two million of these do not involve immediate treatment in the cath lab. In these cases, the procedure is able to rule out narrowed or blocked coronary arteries.

The main question addressed by the DISCHARGE Trial Group was whether the low-risk, non-invasive coronary CT method can provide a safe alternative to catheterization in certain patients with suspected CAD. In order to test the effectiveness of both of these diagnostic imaging techniques in patients with stable chest pain, the project followed more than 3500 patients for a duration of four years. Patients were randomised to either computed tomography or cardiac catheterisation. If their initial evaluation ruled out obstructive coronary artery disease, participants were discharged back to their referring physician for further treatment – a step which gave the trial its name: DISCHARGE. Patients who were diagnosed as having the disease were managed in accordance with European guidelines at the time of the study.

Discussing the long-term results, trial leader Professor Dr Marc Dewey said: “The trial confirmed that a CT-based management is safe in patients with stable (ie, non-acute) chest pain and suspected coronary artery disease.”

Evaluation of safety was based on the incidence of major cardiovascular events over a period of up to four years. He added: “Among the patients referred for cardiac catheterisation and included in this trial, the risk of major adverse cardiovascular events was found to be similar in both the CT and catheterisation groups, occurring in 2.1% and 3.0% of patients, respectively. The incidence of major procedure-related complications was found to be four-times lower in patients managed with an initial CT strategy.”

Other outcome measures were included in the DISCHARGE trial, such as improvements in chest pain and quality of life over the course of the trial. This new strategy could help relieve pressure on health care systems by helping to reduce the volume of catheterisation procedures. Prof Dewey said: “Now that CT has been standardised and quality-tested as part of the DISCHARGE trial, this method could be made more widely available as part of the routine clinical care of people with intermediate CAD risk.”

As a next step, the trial’s method for estimating a person’s clinical risk of having coronary artery disease will need to be further evaluated to determine whether it can improve referral and indication for CT in routine clinical care. Health economics are an important component in making decisions about reimbursement in health care systems. As mentioned in the discussion of the publication, further methodologically very rigorous cost-effectiveness analyses of CT and cardiac catheterisation are necessary and will be conducted by the DISCHARGE Trial Group.

Source: University of Glasgow

Comprehensive Bloodstream Lipid Level Test Can Predict CVD Decades Early

Source: Pixabay CC0

Lipidomics, measuring many different bloodstream lipid levels, can predict the risk of developing type 2 diabetes (T2D) and cardiovascular disease (CVD) years in the future, according to a new study in PLOS Biology. Such early prediction through lipidomic profiling may provide the basis for recommending diet and lifestyle interventions before disease develops.

At present, patient history and current risk behaviours are the main predictors for T2D and CVD, along with high- and low-density cholesterol ratios and levels. But there are over one hundred other types of lipids in the blood, which are thought to at least partially reflect aspects of metabolism and homeostasis throughout the body.

Nowadays, it is possible to measure thousands of individual lipids that make up the lipidome. Nuclear magnetic resonance spectrometry (NMR) metabolomics is also being increasingly used in large cohort studies to report on total levels of selected lipid classes, and relative levels of fatty acid saturation.

To find out if detailed lipid profiles could be better predictors, the authors drew on data and blood samples from a longitudinal health study of over 4000 middle-aged participants, first assessed from 1991 to 1994, with follow-up to 2015. Using baseline blood samples, the concentrations of 184 lipids were assessed. During the follow-up period, 13.8% of participants developed T2D, and 22% developed CVD.

The authors performed repeated training and testing on the data to create a risk model. Once the model was developed, individuals were clustered into one of six subgroups based on their lipidomics profile.

Compared to the group averages, the risk for T2D in the highest-risk group was 37%, an increase in risk of 168%. The risk for CVD in the highest-risk group was 40.5%, an increase in risk of 84%. Significant reductions in risk compared to the averages were also seen in the lowest-risk groups. The increased risk for either disease was independent of known genetic risk factors, and independent of the number of years until disease onset.

Rsk could be individually defined decades before disease onset, possibly in time to take steps to avert disease. Lipidomics could be combined with genetics and patient history to provide new insights into the beginnings of the disease. Additionally, new drug candidates could be identified from the lipids  contributing the greatest risk.

“The lipidomic risk, which is derived from only one single mass-spectrometric measurement that is cheap and fast, could extend traditional risk assessment based on clinical assay,” said lead researcher Chris Lauber of Lipotype. “In addition, individual lipids in blood may be the consequences of or contribute to a wide variety of metabolic processes, which may be individually significant as markers of those processes. If that is true, Lauber said, “the lipidome may provide insights much beyond diabetes and cardiovascular disease risk.”

Lauber added: “Strengthening disease prevention is a global joint effort with many facets. We show how lipidomics can expand our toolkit for early detection of individuals at high risk of developing diabetes and cardiovascular diseases.”

Source: EurekAlert!

New Biosensor Rapidly Measures ATP and Lactate in Blood Samples

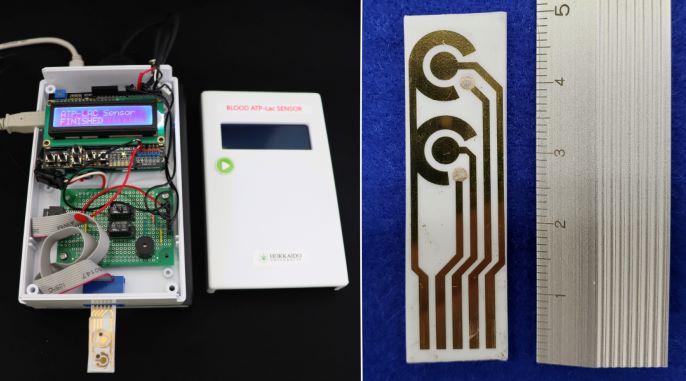
The prototype of the ATP and lactate sensor developed in the study (left); and the integrated sensor chip that detects ATP and lactate levels (right). Credit: Akihiko Ishida, Hokkaido University

Scientists at Hokkaido University have developed a prototype sensor that could help doctors rapidly measures levels of adenosine triphosphate (ATP) and lactate in blood samples from patients, aiding in the rapid assessment of the severity of conditions such as sepsis.

The scientists detailed their prototype biosensor in the journal Biosensors and Bioelectronics.

ATP is a molecule found in every living cell that stores and carries energy. In red blood cells, ATP is produced by a biochemical pathway called the Embden–Meyerhof pathway. Severe illnesses such as multiple organ failure, sepsis and influenza reduce the amounts of ATP produced by red blood cells.

As such, the severity of these illnesses could be gauged by monitoring the amounts of ATP and lactates in a patient’s blood. “In 2013, our co-authors at Tokushima University proposed the ATP-lactate energy risk score (A-LES) for measuring ATP and lactate blood levels to assess acute influenza severity in patients,” explained Akihiko Ishida, an applied chemist at Hokkaido University. “However, current methods to measure these levels and other approaches for measuring disease severity can be cumbersome, lengthy or not sensitive enough. We wanted to develop a rapid, sensitive test to help doctors better triage their patients.”

The researchers developed a biosensor that can detect levels of ATP and lactate in blood with great high sensitivity in as little as five minutes. The process is straightforward. Chemicals are added to a blood sample to extract ATP from red blood cells. Enzymes and substrates are then added to convert ATP and lactate to the same product that can be detected by specially modified electrodes on a sensor chip; the amount of by-product present in the sample increases the electrical current measured.

Schematic representation of the proposed sensor for sequentially detecting ATP and lactate levels in the blood. Through a series of chemical reactions, ATP and lactate are converted to hydrogen peroxide, the breakdown of which to water H2O causes the sensor chip to generate a signal that is detected by the sensor.

The team conducted parallel tests and found that other components present in blood, such as ascorbic acid, pyruvic acid, adenosine diphosphate (ADP), urate and potassium ions, don’t interfere with the ability of the electrodes to accurately detect ATP and lactate. They also compared their sensor with those currently available and found it allowed for the relatively simple and rapid measurement of the two molecules.

“We hope our sensor will enable disease severity monitoring and serve as a tool for diagnosing and treating patients admitted to intensive care units,” said Ishida.

The researchers plan to further simplify the measurement process by integrating an ATP extraction method into the chip itself, as well as reducing the size of the sensor system.

Source: Hokkaido University

Hypersensitivity Link Between MRI and X-Ray Contrast Agents

Photo by Mart Production on Pexels

People with a history of hypersensitivity to iodine-based contrast agents for X-ray based scans, are also susceptible to similar reactions from commonly used MRI contrast agents, according to a large, eight-year cohort study. The study, published in the journal Radiology, also found that premedication or switching to a different MRI contrast agent may reduce risk in patients who have had previous contrast agent reactions.

For a long time, gadolinium-based contrast agents (GBCA) have been used to enhance visualisation of organs, tissues and blood vessels on MRI and provide a more accurate depiction of disease. Though GBCA are relatively safe, recent studies have reported several adverse reactions related to their use, including allergic-like hypersensitivity reactions, such as rash and flushing.

These reactions are increasing in incidence with the widespread use of GBCA, prompting an urgent need for research into risk factors, according to the study’s senior author Hye-Ryun Kang, MD, PhD.

Analysing more than 330 000 cases of GBCA exposure in 154 539 patients over an eight-year period, the researchers found 1304 cases of allergic-like hypersensitivity reactions, for a rate of 0.4%. In patients who had a previous GBCE reaction, the average recurrence rate was 15%.

Acute allergic-like hypersensitivity reactions, or those that occur within one hour of contrast administration, accounted for 1178 cases, while a far smaller number of 126 cases were delayed allergic-like hypersensitivity reactions, or those that occur beyond the first hour and mostly within one week after exposure.

The risk of allergic-like hypersensitivity reactions to GBCAs was higher in those with a history of similar reactions to iodinated contrast media. Normally, having a history of iodinated contrast media hypersensitivity was not thought to be a risk factor for hypersensitivity to GBCAs and vice versa, because of their structural and compositional differences.

“The results of our study challenge this idea,” Dr Kang said.

An underlying predisposition to drug allergies in susceptible patients could be the cause, Dr Kang said, as opposed to any cross-reactivity associated with structural similarities between iodinated contrast media and GBCA. In fact, the risk of hypersensitivity reactions to iodinated contrast media was also higher in those who previously experienced a similar reaction to GBCA.

“Thus, physicians should be aware that patients with a history of hypersensitivity to one of iodinated contrast media or GBCA are at greater risk of developing hypersensitivity reactions to the other,” she said.

Analysis of the data showed that premedication, typically with steroids and antihistamines, and changing the GBCA showed preventive effects in patients with a history of acute allergic-like hypersensitivity reactions. Patients who received premedication and before MRI or were switched to a different GBCA showed the lowest rate of recurrence. Only premedication significantly reduced the incidence of reactions in patients with a history of delayed reactions.

“As the most important preventive measure is avoidance of the culprit agent, a precise record of previously used GBCA should be kept for all patients,” Dr. Kang said. “Physicians should discuss appropriate premedication strategies with their patients prior to MRI procedures.”

Dr Kang nevertheless stressed that contrast-enhanced MRI examinations are invaluable in the diagnosis and follow-up of various diseases, and the overall risk remains low.

“As most of these reactions are mild, we believe the benefits of MRI outweigh the potential risks associated with GBCA use,” she said.

Dr Kang recommended that in all patients receiving an MRI with GBCA exposure, a detailed history of previous hypersensitivity allergic reactions be conducted, and when necessary, appropriate prevention measures should be implemented, such as using premedication and switching to different GBCA types.

Future work would be to perform studies with larger populations to identify possible risk factors and effective preventive strategies for delayed hypersensitivity reactions to GBCA.

Source: Radiological Society of North America